· Caregiving · 12 min read
How to Prepare for a Doctor's Appointment Using Your Health Logs — A Caregiver's Guide
You've been tracking your loved one's health data for weeks. But when the doctor asks "how have they been?" you freeze — because remembering three weeks of numbers is harder than it sounds. Here's how to turn that data into a conversation-changer.
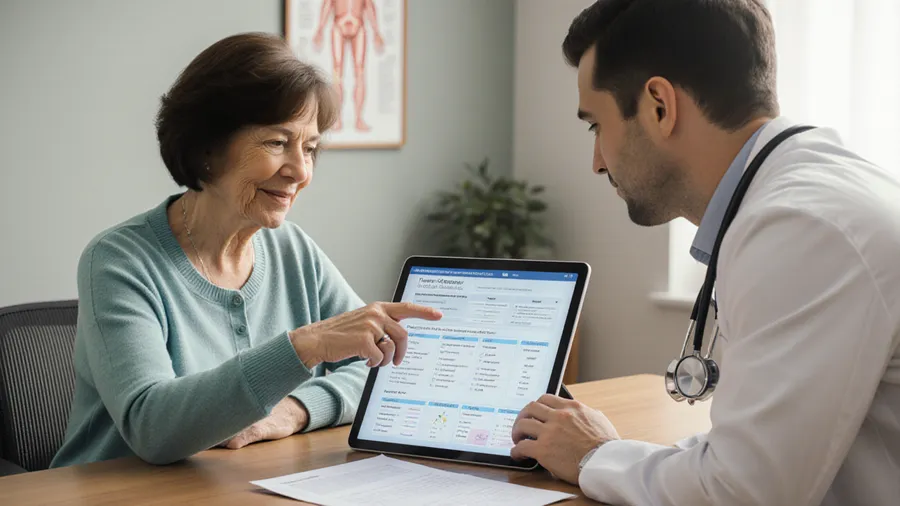
It’s Tuesday morning. Your mother has her cardiology appointment in two hours. You’ve been logging her blood pressure every morning for six weeks — 42 readings, ranging from 138/86 to 152/98. You’ve noted three episodes of dizziness last week. She took her metoprolol on time four days this week and missed it the other three.
The doctor walks in. “So, how have things been?” he asks.
You open your mouth — and realize you can’t remember whether her blood pressure was trending up or down. You know the numbers are somewhere in that log. But right now, in this moment, they might as well not exist.
This is one of the most frustrating gaps in modern healthcare: patients and caregivers spend weeks collecting health data, then walk into a 15-minute appointment unable to translate that data into useful information for their doctor. The effort evaporates at the exact moment it matters most.
But what if you didn’t have to remember? What if, instead of saying “I think her blood pressure has been okay,” you could hand your doctor a single-page report showing exactly how things have changed — with trends, patterns, and flagged events that neither of you would have noticed from memory alone?
That’s not a hypothetical. It’s what happens when you prepare for appointments using structured health logs instead of recollection. And it changes the entire dynamic of the visit.
Why Memory Fails at the Point of Care
The problem isn’t that caregivers don’t track their loved one’s health. Many do — diligently, consistently, over weeks or months. The problem is what happens between tracking and consultation.
White coat amnesia is well-documented: patients forget symptoms, misremember when events started, and can’t recall the frequency of recurring issues when facing a clinician. Caregivers experience this too — but with an added layer. You’re not just trying to remember your own health data; you’re reconstructing someone else’s from fragmented notes, memory, and whatever you happened to write down last night before bed.
A single reading provides a quick snapshot, but a 30-day trend reveals patterns over time—giving your doctor clearer context to evaluate your care plan.
Clinical guidelines from the Agency for Healthcare Research and Quality (AHRQ) emphasize that patient-generated health data (PGHD) — when properly structured and shared — improves clinical decision-making, increases patient satisfaction, and leads to more collaborative treatment decisions. The key word is “structured.” Raw data dumps don’t help doctors. Compressed, clinically-relevant summaries do.
This is not medical advice. Consult your healthcare provider for medical decisions. Health log data should be used to inform conversations with healthcare providers and does not constitute a medical diagnosis or treatment plan. All clinical thresholds and analysis features are designed as observational tools, not diagnostic instruments.
What Makes a Doctor-Ready Report Different From a Data Dump
There’s a big difference between exporting your health logs and generating a doctor-ready clinical report. One is a spreadsheet of numbers. The other is a document designed for the way clinicians actually review patient information.
Here’s what separates them:
Clinical Compression, Not Raw Export
A raw export shows every single log entry — 42 blood pressure readings, 18 heart rate measurements, 9 dizziness episodes, 3 PRN medication entries, plus whatever free-text notes you typed at 11 PM when you couldn’t sleep. That’s a lot of data for a doctor to scan during a time-limited appointment.
A clinically-compressed report transforms that raw data into what matters: daily averages, minimums, and maximums for vitals; symptom trend analysis classifying each symptom as “Worsening,” “Improving,” or “Stable” using linear regression on severity scores over time; frequency comparison showing whether symptoms are more common in the last 7 days versus the prior week; and abnormal event classification flagging entries against established clinical thresholds (heart rate above 100 bpm, systolic blood pressure above 140 mmHg, temperature above 37.5°C).
The result is a document that takes seconds to scan instead of minutes to parse.
Hidden Pattern Discovery
One of the most valuable features of a structured clinical report is its ability to surface correlations you wouldn’t notice on your own. The analysis engine identifies events that co-occur within a two-hour window — for example, noting “Dizziness near Heart Rate spike (Strong correlation)” or “Nausea correlated with Medication ↔ HR.”
Patients and caregivers often arrive at appointments unaware of these patterns. When the report surfaces them proactively, it gives both patient and clinician something they didn’t have before: a shared hypothesis to investigate together.
Time-of-Day Pattern Detection
Symptoms don’t happen randomly. They cluster. The clinical analysis identifies whether symptoms tend to appear in the morning, evening, or around medication times — revealing circadian patterns or potential treatment-response relationships that can guide dosing adjustments.
How to Prepare: A Step-by-Step Framework
1. Review Your Data Before the Appointment
Take ten minutes before your visit to look at what you’ve been tracking. Look for:
- Any trends you want to highlight (improving, worsening, stable)
- Any days that were particularly good or bad
- Any notes or observations you want to discuss
- Any questions that came up while reviewing
This isn’t about memorizing numbers. It’s about identifying the story your data tells so you can communicate it clearly during the appointment.
2. Generate a Clinical Report, Not Just an Export
Most health tracking apps offer some form of data export. But what you need for a doctor’s visit is a clinically-structured report — one that transforms raw logs into organized, scannable information your doctor can actually use.
ProCare Health generates these through a multi-stage pipeline: it assembles patient metadata and all recorded vitals, medications, and symptoms from the selected date range; applies clinical compression rules to aggregate data by day and flag abnormal events; runs trend analysis on symptom severity scores using linear regression; detects correlations between symptom events and vital spikes or medication administration within a two-hour window; and renders everything into a professionally-formatted A4 PDF that follows established clinical documentation conventions.
You select the date range — 7, 14, 30, 60, or 90 days of historical data — generate the report on-device (no internet required), and receive a document ready to share with your healthcare provider. The layout includes a clinical summary with key findings, each symptom displayed with its severity trend and frequency label, medications organized by schedule type, per-day vital cards showing averages against reference ranges, a chronological table of abnormal events with correlation context, and compressed log entries for the most recent period.
3. Identify Your Top 3 Concerns
Doctors have limited time. Before the appointment, identify the three things you most want to address. When the doctor asks “how have things been?” lead with those concerns — and use your report as evidence.
Instead of: “I think her blood pressure has been better lately.” Try: “Over the past six weeks, her average systolic BP dropped from 152 to 136. Here’s the report showing the trend.”
The second version is specific, data-backed, and gives your doctor immediate context for the conversation.
4. Prepare Your Questions
Write down any questions about medications, symptoms, or treatment plan. Bring them to the appointment. It’s easy to forget questions once you’re in the doctor’s office — especially when you’re nervous or distracted. Having them written down ensures nothing gets missed.
5. Share the Report During the Visit
Hand your doctor the printed report. Don’t just show it on your phone — print it or send it ahead of time if possible. A printed document is easier for the doctor to review during the appointment, and it signals that you’ve put thought into this conversation.
The report’s footer disclaimer carefully positions it as “objective observational telemetry” — not a diagnosis, but a factual record. This framing encourages collaborative interpretation: “Here’s what I recorded; what do you make of these patterns?” rather than the patient self-diagnosing from raw numbers.
How ProCare Health’s Doctor Report Helps
The Doctor Report is one of ProCare Health’s most impactful features — and it’s the culmination of everything the app does. Without it, weeks of logging would remain trapped within the app: valuable to you personally but invisible to your care team. With it, the data becomes a bridge between self-management and professional care.
Here’s what makes it different from a simple export:
- Multi-stage clinical compression — Raw health logs are transformed through ReportBuilder (data assembly), ClinicalDataCompressor (trend analysis, frequency comparison, correlation discovery, abnormal event classification against clinical thresholds), and PdfReportGenerator (structured A4 PDF rendering) into a document designed for clinical review
- Symptom trend analysis with linear regression — Each symptom is classified as “Worsening,” “Improving,” or “Stable” based on the trajectory of severity scores over time, giving both patient and clinician a shared vocabulary for discussing direction
- Correlation discovery engine — Identifies events that co-occur within a ±2 hour window: symptom-to-vital correlations (dizziness near heart rate spikes), medication-to-symptom relationships, and timing patterns that reveal potential cause-effect connections the patient may not have noticed
- Time-of-day pattern detection — Reveals whether symptoms cluster in morning, evening, or around medication times, surfacing circadian or treatment-response patterns
- Clinical threshold flagging — Automatically classifies abnormal events against well-established clinical thresholds (HR >100 bpm, BP systolic >140 mmHg, temperature >37.5°C) with human-readable explanations, highlighting clinically significant events requiring attention
- Flexible date ranges — Select 7, 14, 30, 60, or 90 days of historical data depending on the type of appointment and what your doctor needs to see
- Offline-first generation — The entire report is generated on-device. No patient health data leaves the device during creation; sharing happens only when you explicitly invoke the system share sheet. This eliminates dependency on network connectivity and reduces privacy risk
- Temperature unit normalization — Automatically converts Fahrenheit readings to Celsius when values exceed 80, ensuring all temperatures are presented in a single unit system for clinician clarity
- Multi-patient profile support — Family caregivers can generate reports on behalf of elderly relatives or dependents who may have cognitive impairment or limited digital literacy. The caregiver handles the export while the report itself remains clinically structured and physician-friendly
None of this data leaves your phone until you choose to share it. No cloud. No accounts. No tracking. Your health records — as personal as they are — stay yours.
After the Appointment: Continuity of Care
The Doctor Report doesn’t just help with the appointment itself. It creates continuity between visits.
Update your care plan immediately. If the doctor made changes to medications, dosages, or follow-up instructions, record them in ProCare Health right away. Your care plan should always reflect the current treatment plan — not the one from three months ago.
Continue tracking. The data you collect after the appointment is just as important as what you brought to it. It shows whether treatment changes are working and gives you a baseline for comparing future reports.
Schedule your next report generation. Set a reminder to generate another report before your next visit. Consistent, comparable reports across multiple appointments give your doctor an increasingly complete picture of how your loved one’s health is evolving over time.
The Bottom Line
Your health logs are not just personal records. They’re the most accurate clinical information you have between visits — and they’re wasted if they stay trapped in an app or buried in memory.
A structured, clinically-compressed report transforms weeks of self-monitoring into a single document that your doctor can scan in seconds instead of parsing for minutes. It surfaces patterns you didn’t notice. It gives you confidence when the doctor asks “how have things been?” And it turns vague recollection into specific, data-backed communication.
You’ve already done the hard part — tracking consistently. Now use that data to make your next appointment matter.
Generate doctor-ready clinical reports from your health logs in ProCare Health. Structured PDF exports. Symptom trend analysis. Correlation discovery. All your data stays on your device. No account required.
References
Patient-Generated Health Data in Clinical Practice — Agency for Healthcare Research and Quality (AHRQ), evidence review demonstrating that patients who bring organized, structured health data to appointments have more productive visits, higher satisfaction scores, and are more likely to receive timely medication adjustments. ahrq.gov
The Impact of Symptom Tracking on Healthcare Outcomes — Journal of General Internal Medicine, study showing that patients who track symptoms systematically and bring structured data to appointments have more collaborative treatment decisions and report higher satisfaction with their care experience. link.springer.com
Weight Monitoring in Heart Failure Management — Heart Failure Society of America, clinical guideline recommending daily weight measurement and reporting gains greater than 2 lbs in one day or 5 lbs in one week as critical indicators of fluid retention requiring clinical attention. hfsa.org
Medication Adherence and Clinical Outcomes — CDC Grand Rounds, review of how medication adherence data impacts clinical decision-making and treatment adjustments. Patients who bring structured adherence records to appointments receive more targeted, evidence-based treatment modifications. cdc.gov/mmwr/volumes/66/wr/mm6645a2.htm
Sleep and Mood Data in Clinical Practice — npj Digital Medicine, study showing that sleep and mood data collected via digital tools provides valuable clinical information that patients frequently omit from verbal reports, leading to more complete clinical assessments when shared with providers. nature.com/articles/s41746-024-01333-z
Preparing for a Doctor’s Appointment: A Patient’s Guide — Mayo Clinic, patient education on how to prepare for medical appointments, including bringing relevant health data, organizing concerns by priority, and preparing specific questions for the provider. mayoclinic.org
Blood Pressure Monitoring and Clinical Decision-Making — American Heart Association, guidelines on home blood pressure monitoring and how longitudinal trend data is used for treatment adjustments versus single-reading measurements. heart.org
Digital Health Tools for Patient-Provider Communication — JAMA Network Open, study demonstrating that digital health tools improve patient-provider communication quality and clinical outcomes when patients share organized, structured health data rather than relying on verbal recall. jamanetwork.com
Care Plan Documentation and Treatment Adherence — National Institute on Aging, evidence that updated, accessible care plans improve treatment adherence rates and overall patient outcomes across chronic disease populations. nia.nih.gov
Patient Engagement and Healthcare Outcomes — Health Affairs, systematic review showing that active patient engagement through health data tracking, structured sharing, and collaborative decision-making improves clinical outcomes, reduces hospitalizations, and increases both patient and provider satisfaction. healthaffairs.org